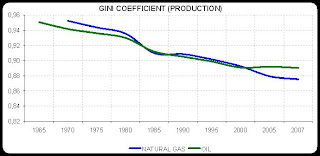
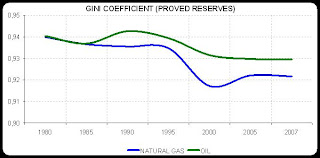
So, tryin' to understand a little bit about it I downloaded 2008 BP Statistical Review (2009 is on the way...) and draw a few charts. I was particulary interested in understanding the world distribution of Natural Gas & Oil Proved Reserves as well as its production. To make it easier to analyze the huge set of data avaliab
 le I thought that the Gini Coefficient Index could be easily. Regarding that the overall idea about the index is that the closer it is to 1 the more concentrated that variable is, the following charts illustrate what happened in the last 50 years in both markets.
Way more important than the number itselves are the trends one can see. At least two conclusions we can get: i) For both, Oil & Gas, there's a much higher concentration of the proved reserves rather than the Production. ii) Oil & Gas Production pattern is extremely similar over the time.

So, the question is, assuming those similarities, why there's an institution called OPEC that "...coordinate and unify the petroleum policies of its Member Countries..." and to Natural Gas there ain't something like? Why is this so?
For sure natural gas isn't a tradeable, "a commodity", so that institution could only act locally, right? But, when we take a look at the huge ever growing Liquified Natural Gas (LNG) world commerce in the last few years it is possible to imagine that this could be a trend, right? (as soon as I find out a good free database with it I'll post it here, ok?)
I would like to know what you think....
Nenhum comentário:
Postar um comentário