terça-feira, 31 de agosto de 2010

Time After Time....

It's been some time since I've been daily working with excel and if there's one thing I can say is that, oftenly we have to schedule a specific task to be done at any sheet...

Thinking about that I've decided to Upload TimeAfterTime.xls which runs & repeat a macro at a specific time definided by the user. Thanks a lot to AdilsonSoledade who first designed the extremely clear-and-simple code.

Very useful

segunda-feira, 13 de julho de 2009

An emergent "OPEC" for natural gas?

Natural gas and Oil are two sources of energy frequently associated. Common sense tell us that they might have similar E&P costs, their prices could be strongly correlated and for some uses one could easily substitute the other.

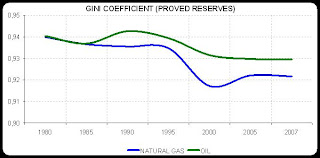
So, tryin' to understand a little bit about it I downloaded 2008 BP Statistical Review (2009 is on the way...) and draw a few charts. I was particulary interested in understanding the world distribution of Natural Gas & Oil Proved Reserves as well as its production. To make it easier to analyze the huge set of data avaliab
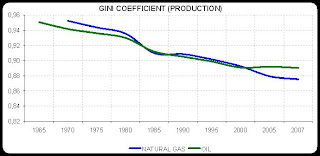
le I thought that the Gini Coefficient Index could be easily. Regarding that the overall idea about the index is that the closer it is to 1 the more concentrated that variable is, the following charts illustrate what happened in the last 50 years in both markets.

Way more important than the number itselves are the trends one can see. At least two conclusions we can get: i) For both, Oil & Gas, there's a much higher concentration of the proved reserves rather than the Production. ii) Oil & Gas Production pattern is extremely similar over the time.

So, the question is, assuming those similarities, why there's an institution called OPEC that "...coordinate and unify the petroleum policies of its Member Countries..." and to Natural Gas there ain't something like? Why is this so?

For sure natural gas isn't a tradeable, "a commodity", so that institution could only act locally, right? But, when we take a look at the huge ever growing Liquified Natural Gas (LNG) world commerce in the last few years it is possible to imagine that this could be a trend, right? (as soon as I find out a good free database with it I'll post it here, ok?)

I would like to know what you think....

quinta-feira, 28 de maio de 2009

It's a Copy-Paste World


What the french chemist, Antoine-Laurent de Lavoisier, said long time ago could easily be applied to many current issues.Whether you're at the school, at the office, or just trying to show some data to your neighbours about how strong would be the FREE-RIDER effect of that firework party... well, in the end, it's always about a Powerpoit presentation whose data comes from an Excel Sheet......

Thinking about that, I tried to make the life of some of us a little bit easier by adding some automation in the interaction of those applications. The following excel sheet contains a macro which runs a "copy-paste routine" with selected charts and ranges of data from excel sheets to a new powerpoint presentation. For each set of data (ranges and charts), the macro creates a new ppt slide and copy them.

(ENGLISH VERSION)
http://rapidshare.com/files/238383355/XLSPPT_EN.xls.html
(PORTUGUESE VERSION)
http://rapidshare.com/files/238383245/XLSPPT_PT.xls.html

To run the macro press CTRL+a. As you will see, the rows 10-14 are the sample range where u can add and delete the data that will be pasted at the ppt thru the macro. The default sheet contains 20 sets of data, therefore, if you press ctrl+a it should create 20 new slides with the respective data (copied as image).

3 things to keep in mind :
1) enable macros at your sheet;
2) row 10 must be a number -it's a header and its data must be a crescent integer - 1, 2, 3 and so on....-
3) if your excel is in english use XLSPPT_EN ... if it's in Portuguese, use XLSPPT_PT


Last but not least.. VLOOKUP, MAX and MIN are the key functions to let the macro do the work!

Well, is there any easier way to do it? Let me know about it!